Managing Resources in My Environment
Overview
My Environment provides a centralized view to discover, organize, and manage your organization’s resources.
It includes Inventory and Applications: Inventory shows a detailed list of your resources, and Applications groups resources by application context.
Note
My Environment is an updated navigation experience.
It now includes Inventory and Applications in place of the previous Resource Dashboard and Resource Table. The content on Applications currently mirrors the old dashboard view and will evolve.
Jit Resources allows you to:
- Automatically discover and score the risk of code resources: Jit provides a continuously updated inventory of all code repos in your environment, which are assigned a risk score depending on the risk that unresolved security issues introduce.
- Automatically group resources according to risk factors to focus prioritization: Instantly pull up all resources that are in production, accessible via the internet, or call a database, and view all of the security issues within them.
- Manually group and classify resources to track the security posture of critical services, applications, and other categorization vectors: manually tag specific resources by service, application business line, or other vectors, so you can easily monitor their security risk.
Applications
The Applications page is the entry point under My Environment for viewing your resources grouped by application context.
Key Components
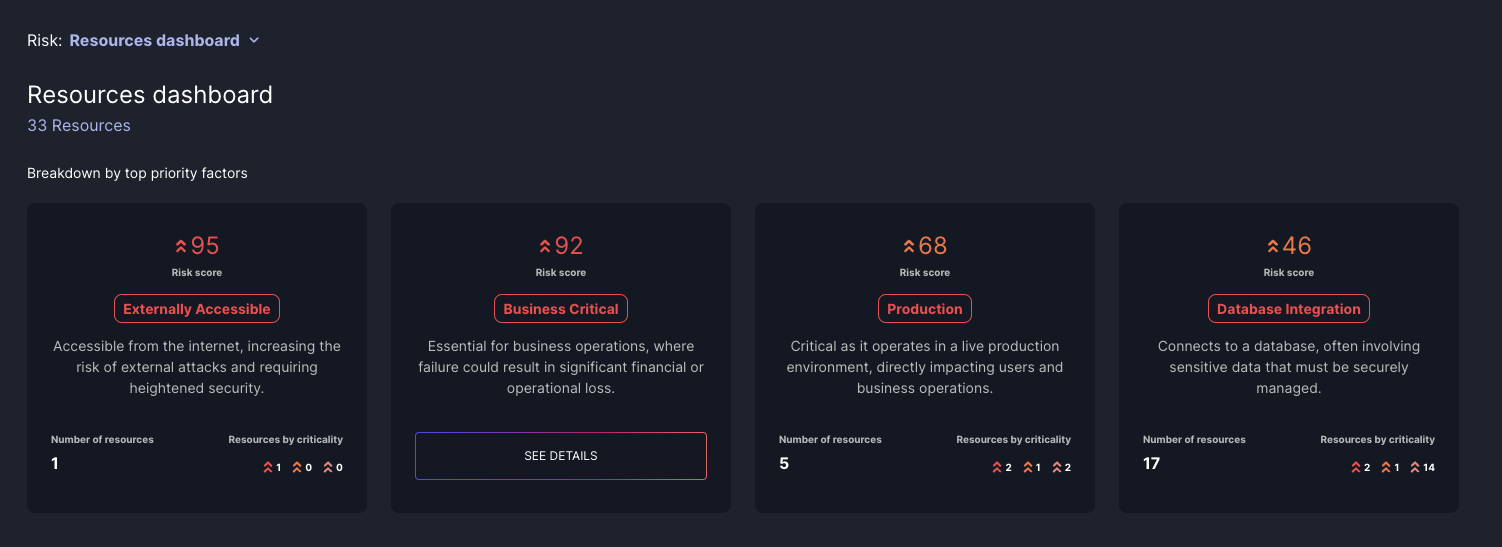
Priority Factor Tiles
Priority Factors are characteristics of a resource that impact the priority of security issues that reside within it. At the top of the page, you'll see tiles representing different priority factors such as:
- Production Environment: consolidates all resources within your production environment
- Internet-Facing: consolidates all resources that are externally accessible via the internet
- Database Access: consolidates all resources that have access to a database
- Business-Critical Service: consolidates all business-critical services, which are manually tagged
Tag Group Tiles
Below the Priority Factor tiles on the Applications page, you'll find tiles that refer to specific tag groups. These tiles represent custom tags that you have assigned to your resources. Manual tags allow you to group resources based on criteria that are most relevant to your organization, such as specific applications, teams, microservices, or any other categorization you choose.
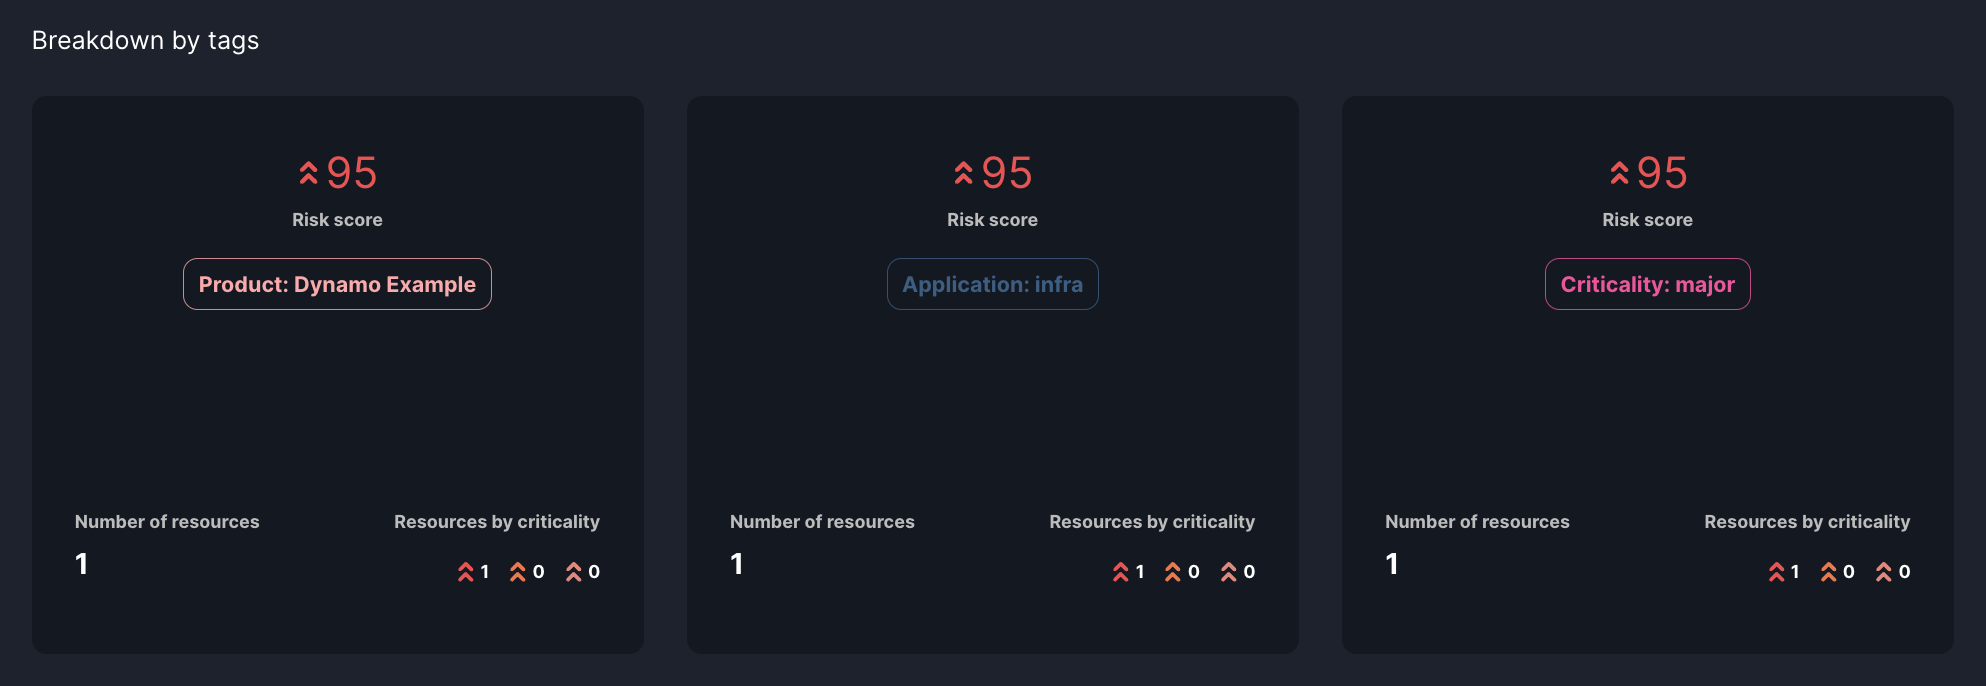
Each tile displays the number of resources that fall under that specific priority factor and the aggregated risk score for resources within each priority factor or tag, helping you quickly identify areas of concern.
Click on any tile to view resources associated with that priority factor or tag.
Inventory
Inventory is a dedicated page under My Environment that provides a detailed, tabular view of all resources in your environment.
Key Components
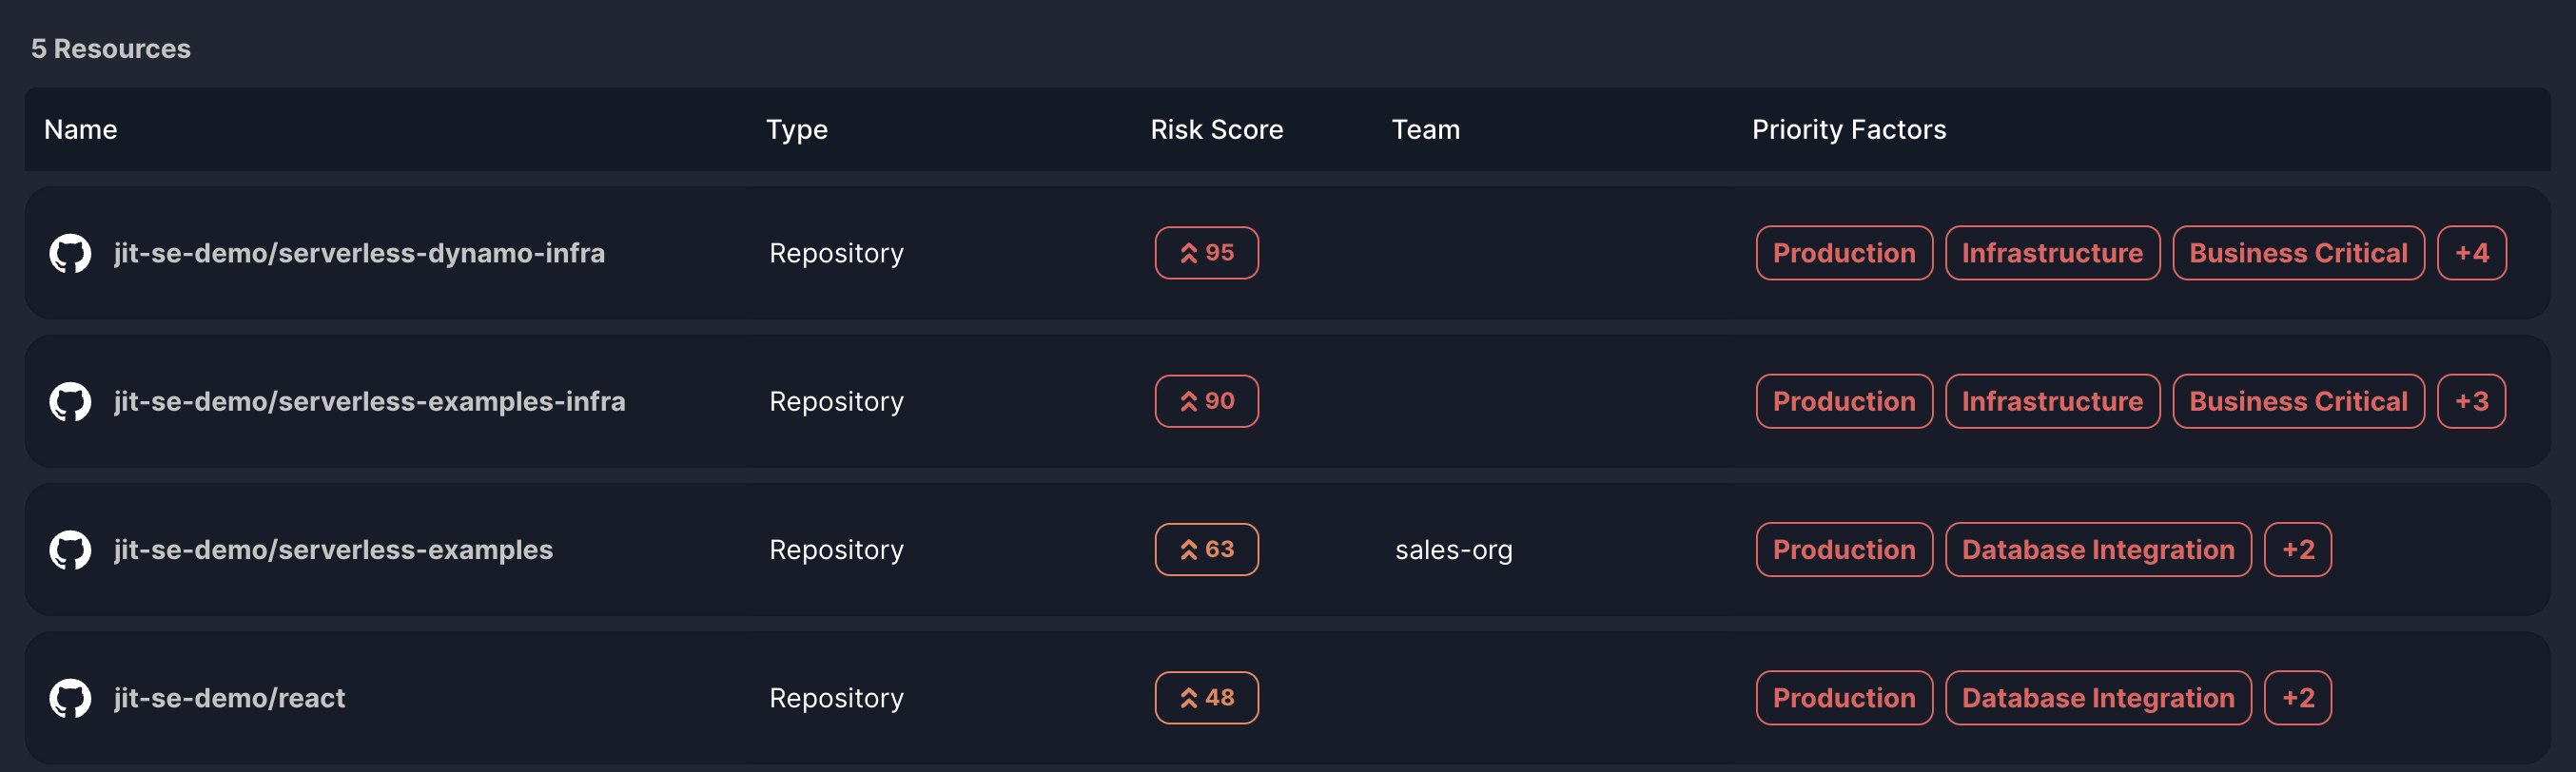
Resource Table
A tabulated list of resources with the following columns:
| Column | Description | Example |
|---|---|---|
| Name | The name of the code repository or cloud service. | jit/react |
| Type | code repository or cloud service. | Repository |
| Risk Score | The numerical score represents the resource's criticality based on unresolved security issues and priority factors created by the context engine. | 85 |
| Team | The team that is responsible for the repository. | The A-team |
| Priority Factors | Labels indicating which priority factors apply to each resource. | Production |
Sorting and Filtering
Options to sort resources by the table properties.

Link to all associated findings
When you click the link to the Findings on the top right corner of the screen, it is filtered to display only the findings associated with the resources in your current view. This also presents the distribution of the criticalities of these findings. For example, if the Inventory Table is filtered to show only resources with the priority factor "Production", the link will lead to a Findings view displaying only the findings found on production resources.
The Resource Page
Clicking on a specific resource from the Inventory takes you to the Resource Page, which provides an in-depth view of the selected resource, including its connections, security issues, and detailed properties.
Key Components
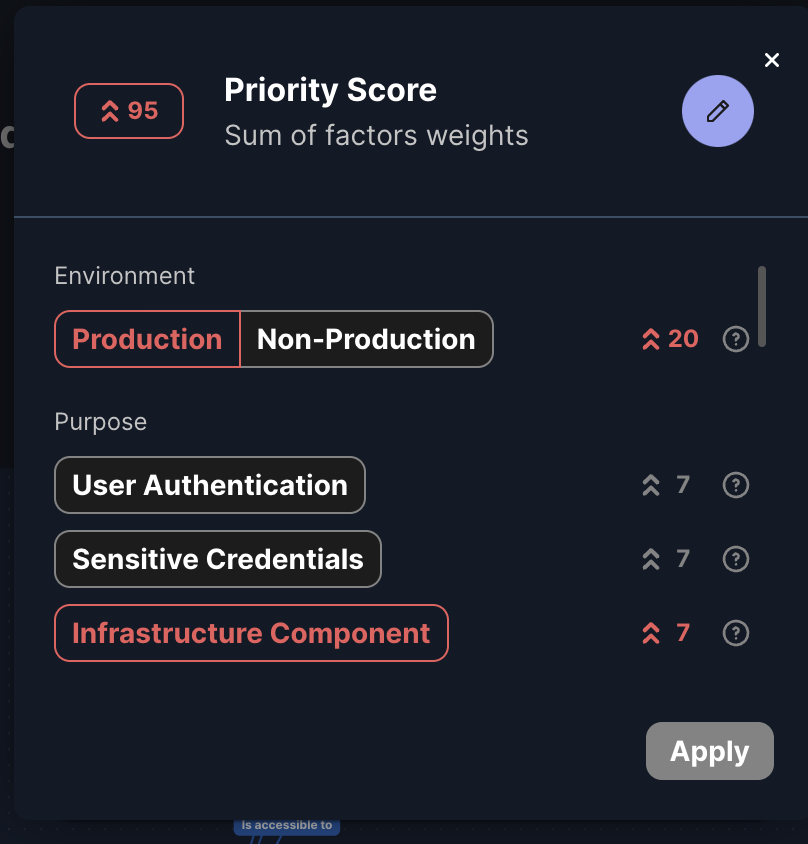
Priority Factors and Risk Score
At the top, the resource is labeled with its priority factors, such as "Production Environment" or "Externally Accessible," indicating why it's critical. The risk score is calculated by summing the weights of each assigned priority factor, reflecting the resource's overall criticality.

You can manually adjust the priority factors to accurately represent the resource's importance. Once you change a priority factor, it will affect the priority of the resource and its associated findings from that point forward, making it a reliable way to preserve and maintain accurate information about your assets.
Manual tags
On the Resource Page, you can view and manage the manual tags assigned to the resource. These tags appear alongside priority factors at the top of the page. You can add or remove tags to accurately reflect the resource's role within your environment.
To assign new manual tags to the resource, click on the 'Add Tag' button. Tags are created using a key-value structure, where the key determines the type or category of the tag, and the value specifies the name or identifier. For example, you can use Key: Application, Value: Payment to tag a resource associated with the Payment application.
Adjusting manual tags updates how the resource is grouped in the Aplications page and affects the aggregation of risk scores in the corresponding manual tag tiles.
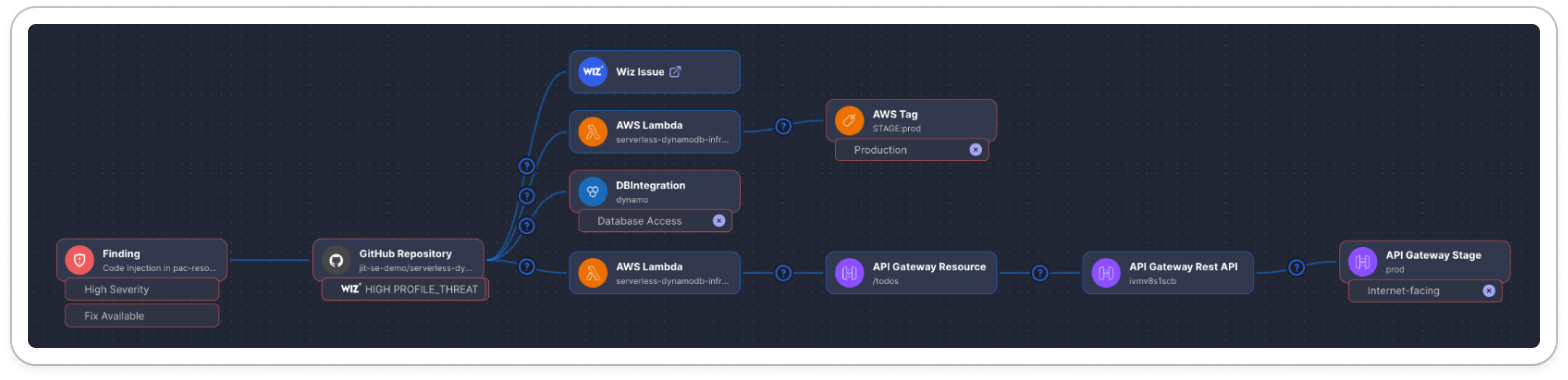
Context engine graph
Below the risk score, the Context Engine Graph visually maps how the resource connects to other elements in your environment. This visualization helps you understand relationships and potential impact pathways, illustrating how vulnerabilities might propagate. Importantly, the graph can be used as a justification or explanation of how the priority factors were concluded. By examining the connections and dependencies shown in the graph, you can see why certain priority factors apply to the resource based on its interactions within your environment.
Findings
Further down, the Findings section lists all unresolved security issues associated with the resource. Each finding includes details like the issue name, severity, type, and detection date, allowing you to assess vulnerabilities and plan remediation steps.
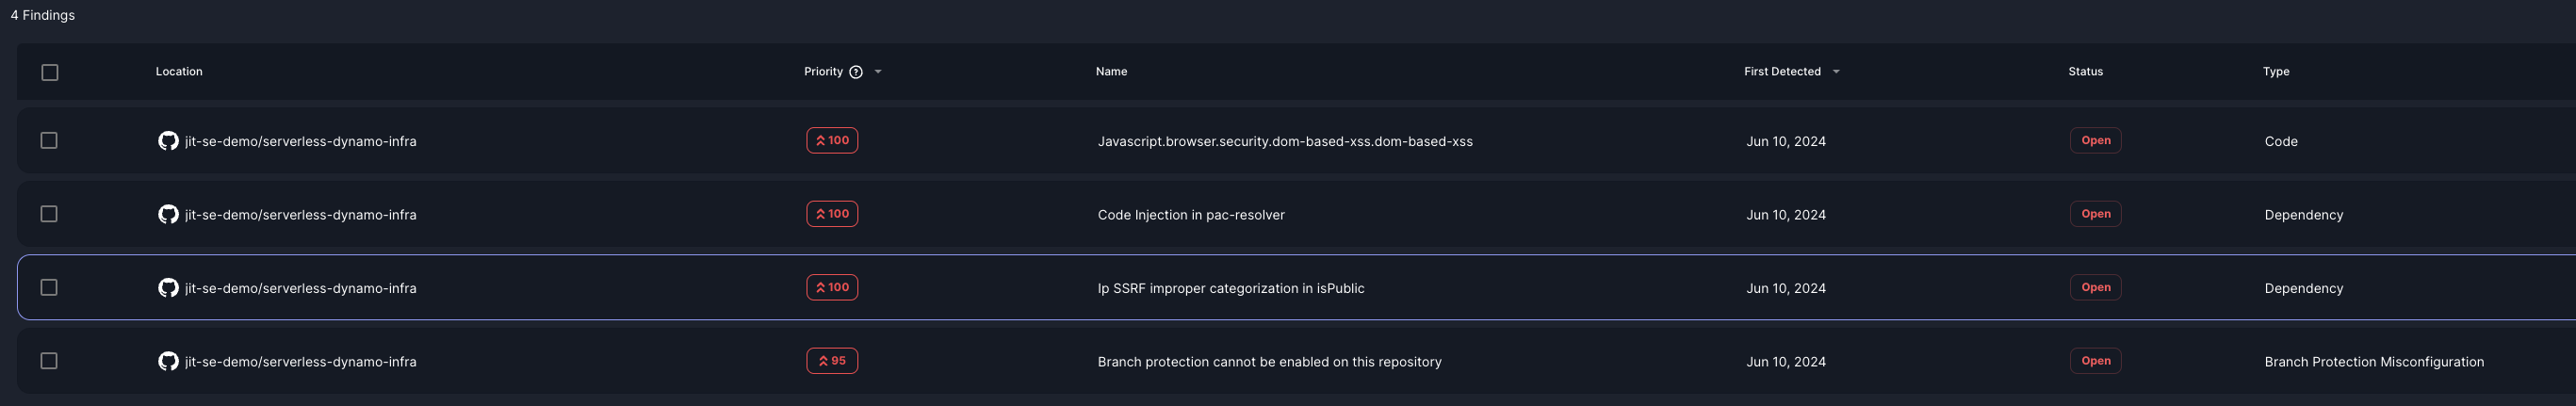
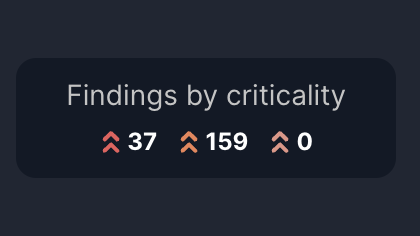
Findings by criticality
At the top-right corner, a summary categorizes the findings by their severity levels—Critical, High, and Medium/Low. This breakdown helps you understand the distribution of severities among the findings for this asset
Updated 5 months ago